
Technical review: Mr. Sun, Technical Manager
Summary: Laser vibrometry measures specimen response without attaching a sensor, reducing mass-loading effects in damping and natural-frequency tests. Reliable results still require controlled boundary conditions, suitable excitation, adequate decay length and a stated identification method.
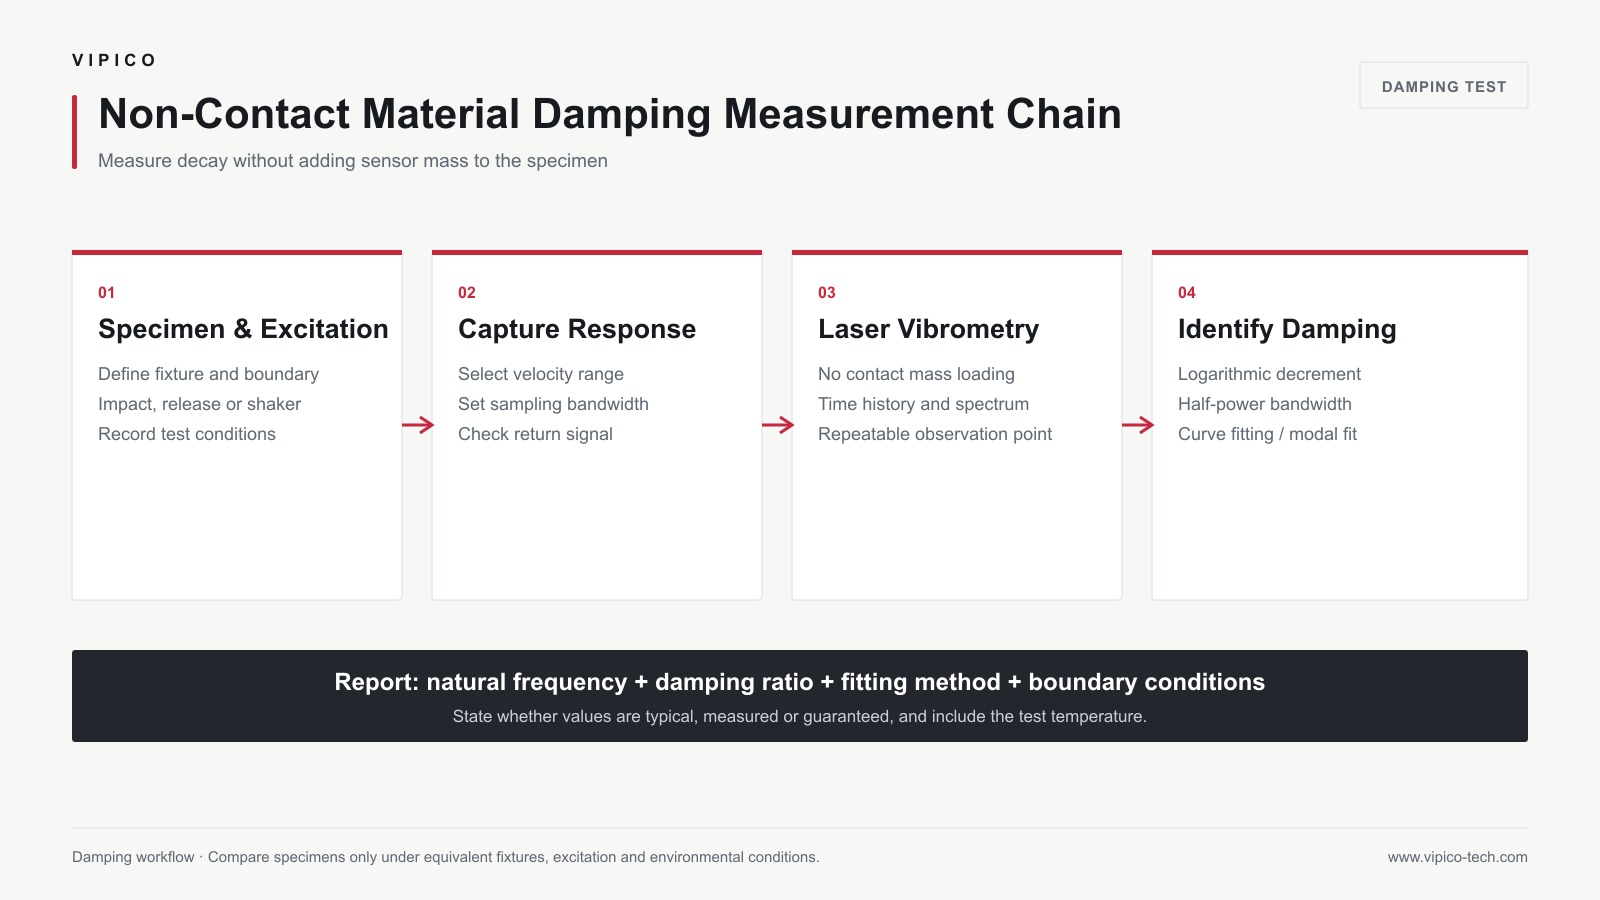
Why Non-Contact Response Measurement Matters
Damping tests are often performed on slender, lightweight or high-frequency specimens. An accelerometer, cable or adhesive layer can change local mass, stiffness and energy dissipation. A laser vibrometer minimizes these mechanical changes while retaining a measurable response at the selected point.
Define the Test Object and Boundary
Material damping is not observed independently of specimen geometry and fixture conditions. Record material batch, dimensions, orientation, surface treatment, temperature, humidity, preload and support. Free-free suspension, cantilever fixtures and standardized beam methods lead to different system-level damping values.
Excitation and Acquisition Options
| Approach | Strength | Key control |
|---|---|---|
| Impulse excitation | Fast broadband response | Impact location, force spectrum and double-hit rejection |
| Shaker excitation | Controlled level and repeatability | Fixture interaction, force control and sweep rate |
| Free decay | Direct observation of ring-down | Sufficient decay duration and noise floor |
| Random excitation | Broadband averaging and FRFs | Stationarity, averaging and coherence |
Damping Identification Methods
Logarithmic Decrement
For a lightly damped single-mode decay, the logarithmic decrement can be estimated from successive peaks. The selected time interval should be dominated by one mode and remain above the noise floor.
Half-Power Bandwidth
Damping can be estimated from the frequencies around a resonance where response power falls to half the peak level. Frequency resolution, nearby modes and leakage affect the result.
Curve Fitting and Modal Identification
Frequency-domain or time-domain curve fitting can separate multiple modes and estimate poles. Report the model order, stabilization criteria and validation indicators rather than only the final damping number.
Natural-Frequency Measurement
Natural frequencies may be identified from response spectra, FRFs or modal poles. A spectral peak alone can also reflect excitation harmonics, rigid-body motion or measurement artifacts, so repeatability, phase behavior and method-appropriate checks are essential.
Quality-Control Checklist
- Document specimen, fixture and environment
- Verify laser signal level and avoid clipping
- Choose record length and resolution for the lowest damping expected
- Repeat the test at multiple excitation levels where linearity is assumed
- Compare selected measurement points and configurations
- Report estimator, frequency band, uncertainty and exclusions
Frequently Asked Questions
Does non-contact measurement remove all test influence?
No. It reduces sensor mass loading, but fixtures, excitation, optical preparation, air damping and environmental conditions still influence the measured system.
Can damping from different fixtures be compared directly?
Only with caution. Boundary conditions can dominate energy loss. Comparisons should use equivalent specimen geometry, fixture, preload, environment and estimator.
Why do damping values vary more than natural frequencies?
Damping is more sensitive to joints, friction, temperature, amplitude, noise and estimator choices. Its uncertainty should be reported explicitly.
Related Products and Resources
- Gimbal Scanning Laser Vibrometer
- Laser Vibrometry Technology
- Application Solutions
- Contact VIPICO Engineering