
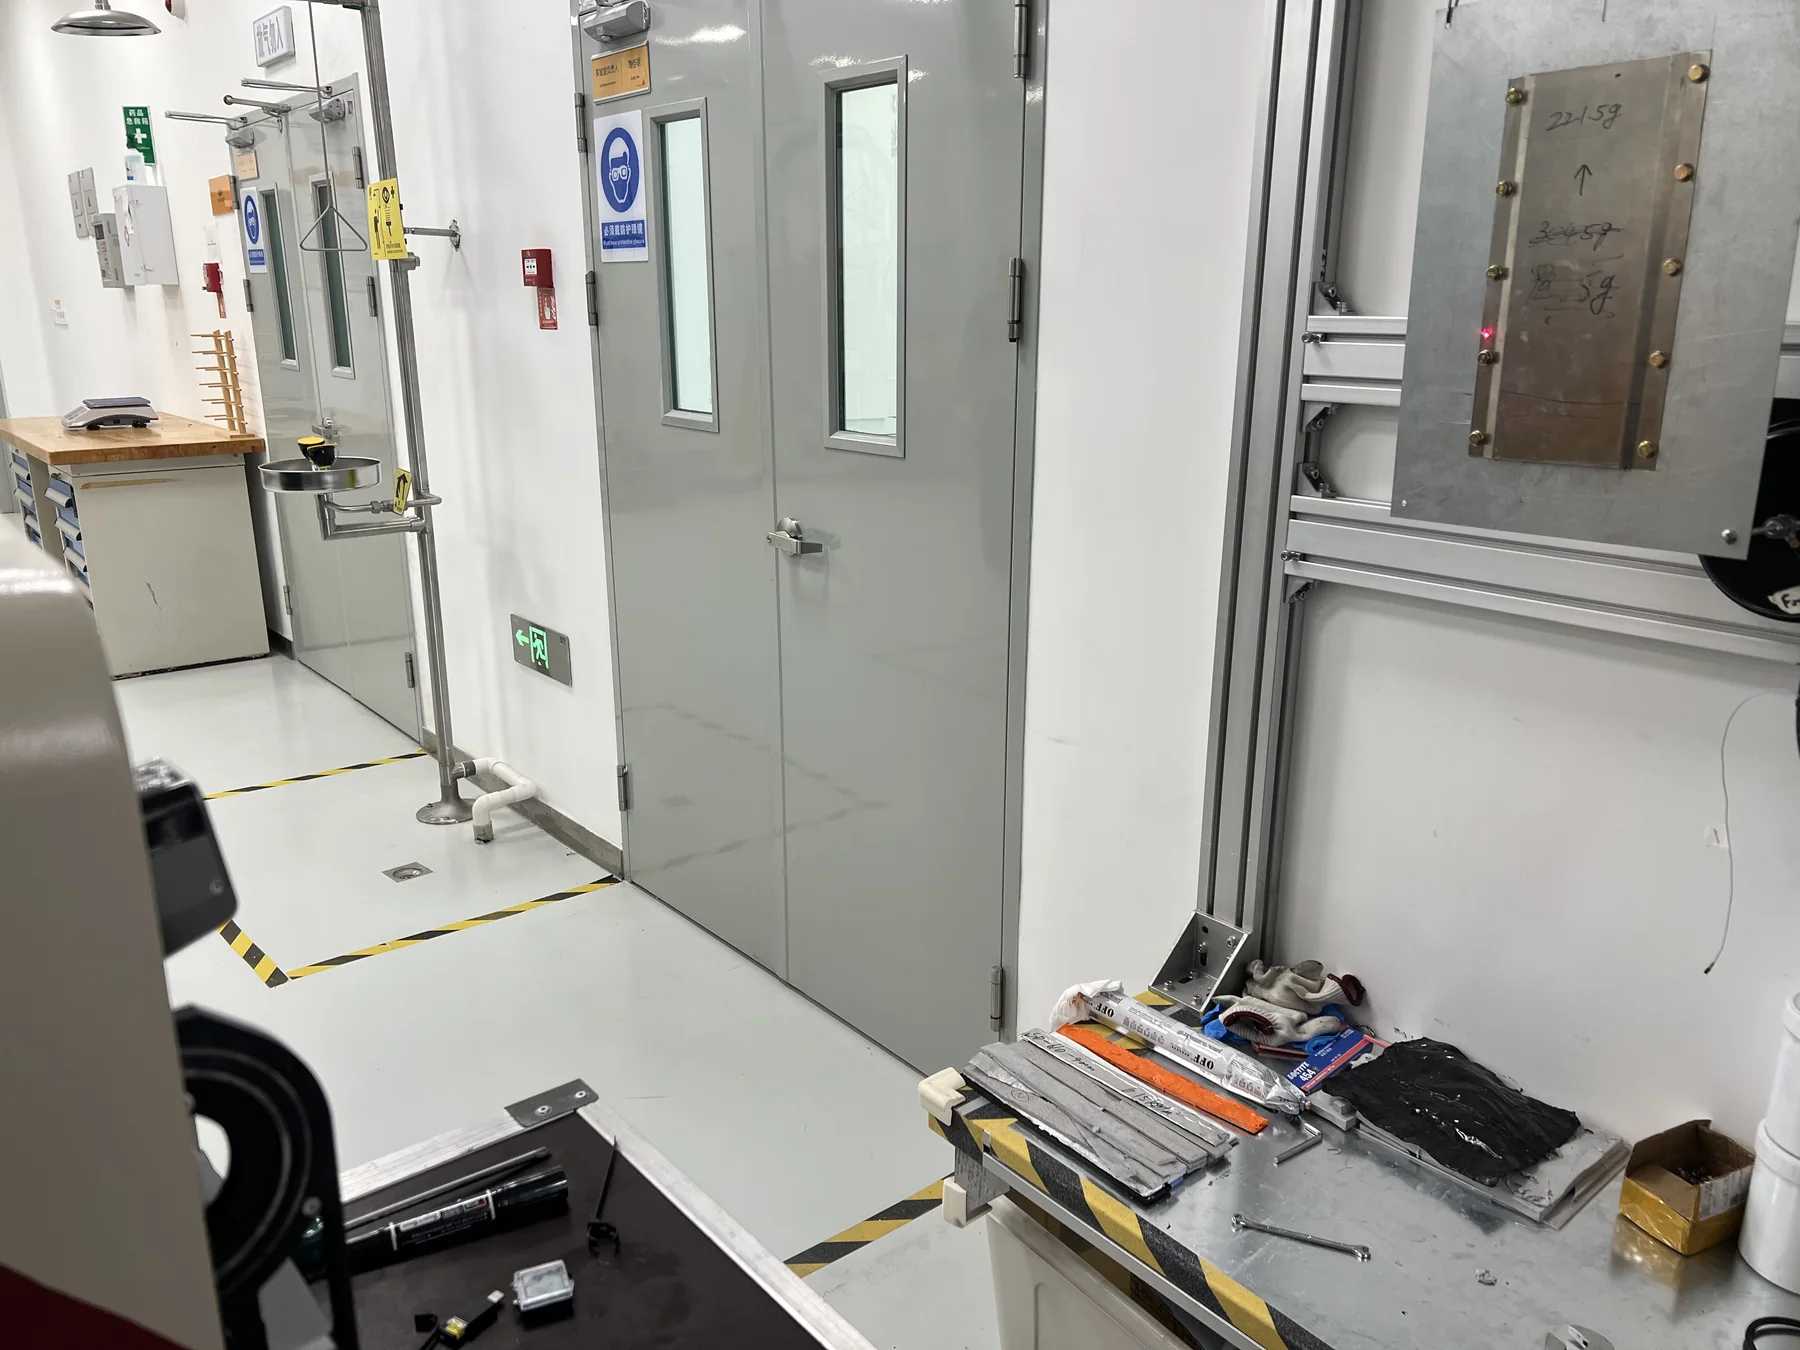
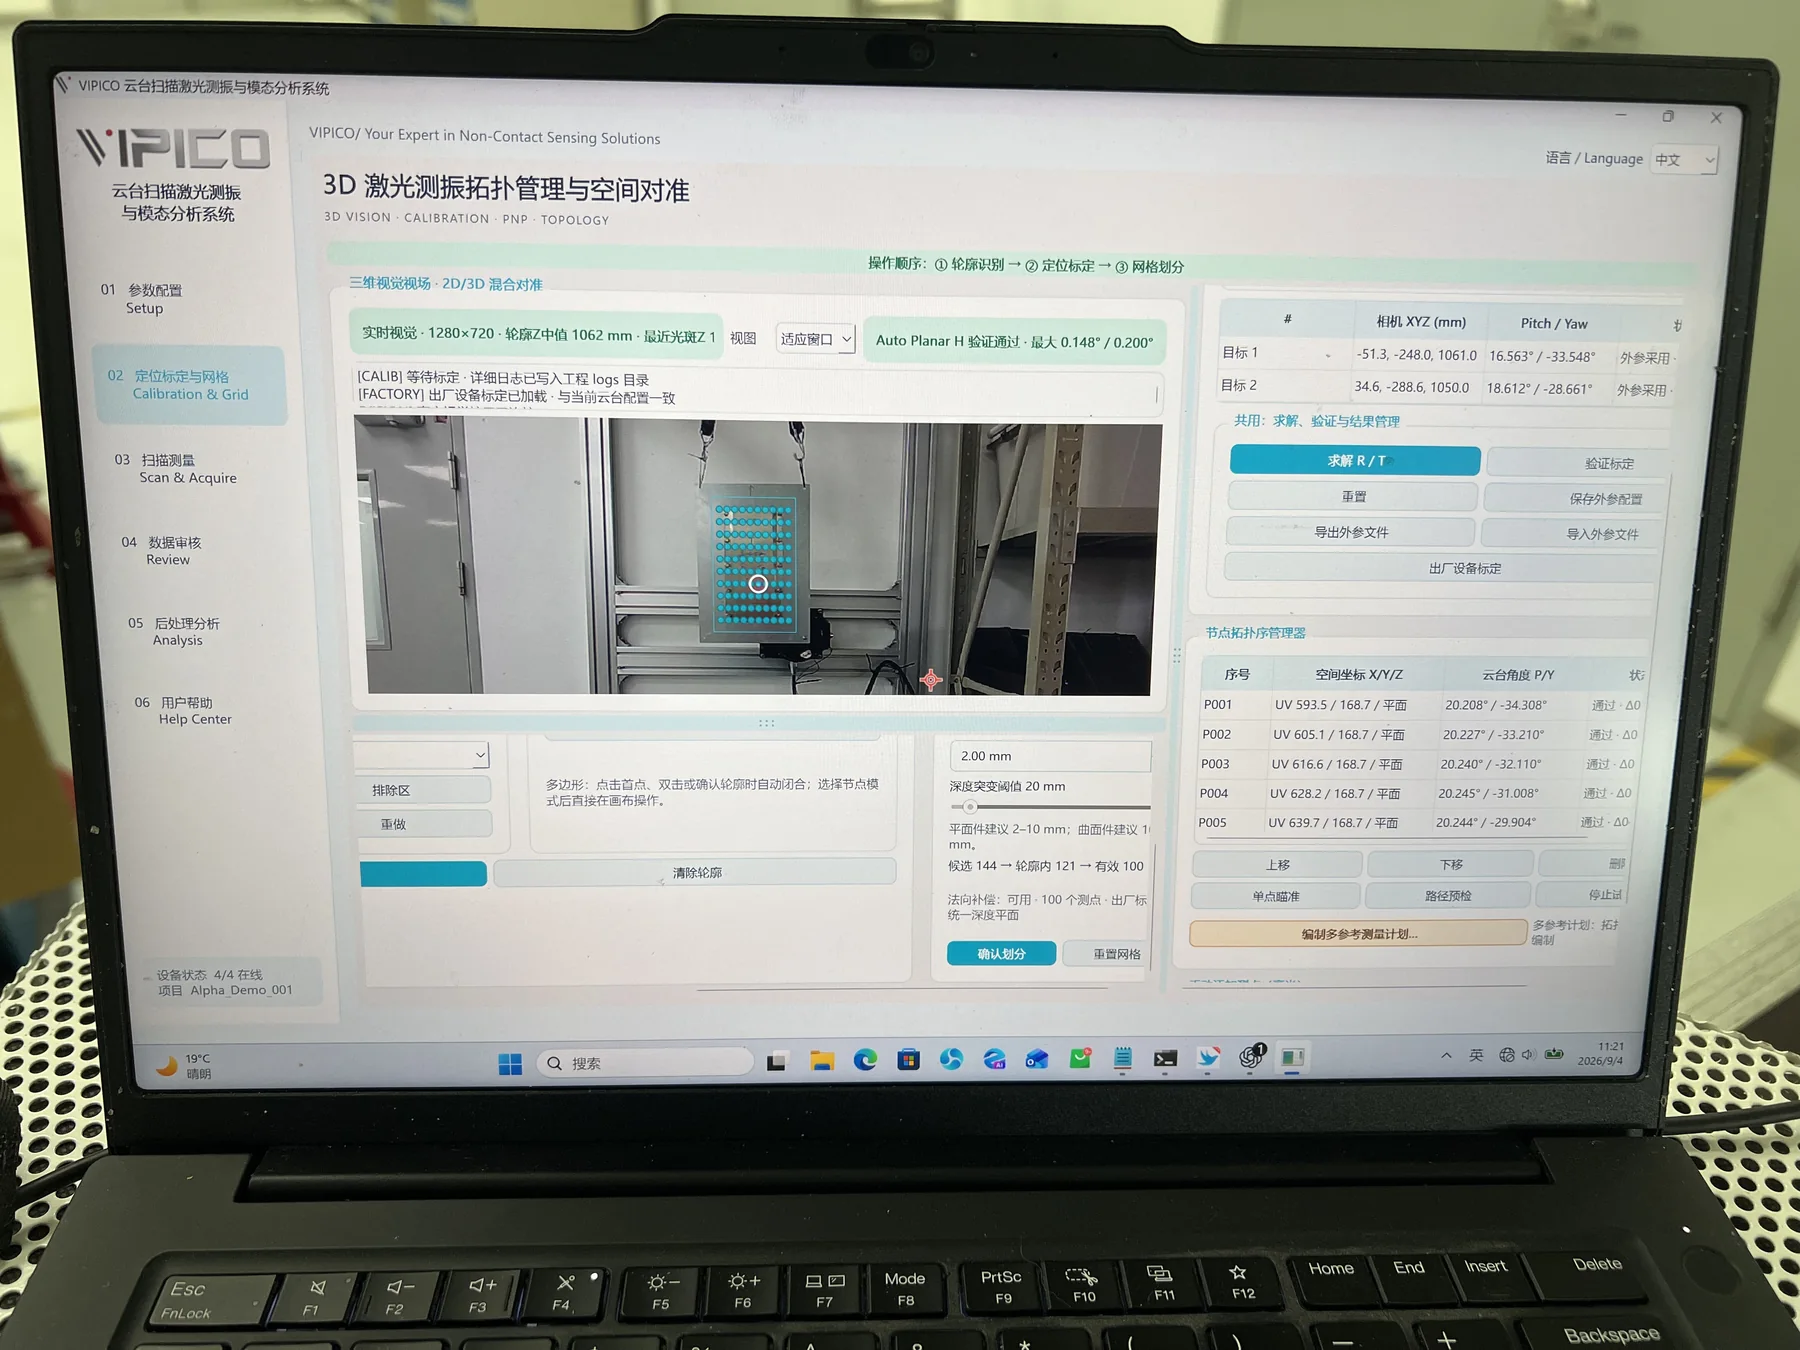
VIPICO recently visited Sika China’s Acoustic R&D Center to carry out non-contact operational deflection shape testing on a multilayer damping material specimen. A gimbal scanning laser vibrometer was used to align the measurement area, plan the scan grid, acquire vibration responses point by point, and reconstruct the spatial motion of the specimen at selected operating conditions and frequencies.
This article focuses on the measurement method and quality controls. Material formulations, specimen dimensions, excitation bands, and quantitative results are project information and are not disclosed here.
What an ODS Test Actually Shows
An operational deflection shape, or ODS, describes how a structure moves at a specific frequency, order, or operating condition. When the amplitude and relative phase from multiple locations are mapped to the test geometry, engineers can see nodal regions, local response concentrations, and the motion relationship between different parts of the specimen.
An ODS is not automatically a mode shape. It may contain the combined effects of structural modes, direct forced response, boundary conditions, and modal superposition. It answers the practical question “How is the structure moving under this condition?” It does not, by itself, provide an independently identified natural frequency, damping ratio, or modal model. Those parameters require an appropriate experimental modal analysis or operational modal analysis workflow and suitable input or reference data.
For a detailed method comparison, see ODS vs OMA vs EMA.
Why Use a Scanning Laser Vibrometer for Multilayer Damping Structures
Multilayer damping structures combine a base material with damping, constraining, adhesive, or functional layers. Their measured response can be influenced by local stiffness, distributed mass, viscoelastic behavior, interfaces, and the way the specimen is mounted. On thin or lightweight specimens, mounting many accelerometers may alter the local dynamics and restrict the practical spatial resolution.
A scanning laser vibrometer measures motion optically and does not add sensor mass at each response point. After the measurement geometry is aligned, the instrument follows a defined grid and maps each response back to the specimen surface. This is useful when the task is to:
- visualize global and local operating deflection at a target frequency;
- increase spatial point density and reveal localized motion that a sparse grid may miss;
- compare surface response without changing the specimen mass at every point;
- identify regions for further testing, design review, or modal analysis.
Non-contact measurement does not remove the need for controlled test conditions. Surface reflectivity, incidence angle, working distance, fixture boundary conditions, excitation stability, and the phase reference all affect the result and must be checked during setup and data review.
Test Workflow from Spatial Alignment to ODS Visualization
| Stage | Main task | Quality control and output |
|---|---|---|
| 1. Define the objective and boundary | Confirm the specimen, mounting method, frequency region of interest, and comparison areas | Record the boundary conditions so fixture differences are not mistaken for material behavior |
| 2. Align geometry and plan the grid | Establish the spatial relationship between the camera, laser, and specimen; define valid scan points | Check occlusion, incidence angle, surface return, and point accessibility |
| 3. Configure excitation and reference | Select excitation and reference channels according to the test objective | Maintain comparable excitation during scanning and use a stable common reference when phase is required |
| 4. Acquire non-contact response | Measure each planned point along the defined scan path | Review signal-to-noise ratio, overload, signal loss, outliers, and repeatability |
| 5. Reconstruct the ODS | Combine point amplitudes and phases at the target frequency or operating condition | Separate credible motion from noise and fixture-related local effects |
| 6. Interpret the result | Compare response concentrations, nodal areas, and relative motion | Use ODS to describe operating motion; identify modal parameters only through a separate validated procedure |
The goal is not simply to complete a large number of scan points. Each point must be located consistently, responses must remain comparable during the scan, and rejected or repeated data must be traceable. The VIPICO workflow links vision-assisted alignment, automated scanning, data review, and post-processing so that geometry, response data, and engineering decisions remain connected.
How ODS Supports Modal Analysis
ODS and modal analysis serve different but complementary purposes. ODS first makes the observed problem visible: where motion is concentrated, which regions move in or out of phase, and whether a local feature participates strongly at the frequency of interest. The next analysis step depends on the available data and the engineering objective.
- With measured input force and frequency response functions, EMA can be used to identify natural frequencies, damping, and mode shapes.
- When input forces are not measured but qualified multi-point operating responses and fixed reference data are available, OMA may be considered.
- When the objective is to reproduce the actual deformation at a known operating frequency, ODS is often the most direct result.
For this reason, a response peak should not automatically be labelled a structural mode, and an ODS animation should not be presented as a damping measurement. The measurement question must be defined before the analysis method is selected.
Engineering Value of the Site Test
The multilayer damping material test demonstrates a complete non-contact workflow: review the specimen boundary, align the measurement geometry, plan the scan grid, acquire point responses with a scanning laser vibrometer, review the data, and visualize the operating deflection shape. The resulting spatial evidence can support specimen comparison, measurement-point optimization, further modal analysis, and design discussion.
For material development, the value is not the animation alone. The value comes from converting separate response spectra into a spatial result that can be reviewed and repeated. Valid specimen comparison also requires consistent fixtures, excitation conditions, scan grids, environmental conditions, and processing rules.

Related VIPICO Resources
Learn more about the VIPICO gimbal scanning laser vibrometer and its workflow for automated scan planning and non-contact vibration visualization. For method selection, read ODS vs OMA vs EMA. If the task involves laboratory material or structural testing, review Research and Laboratory Testing Solutions or contact the VIPICO engineering team.
Frequently Asked Questions
Is an ODS the same as a mode shape?
No. An ODS is the actual response pattern at a selected operating condition and may contain forced response and contributions from several modes. A mode shape is a property of an identified modal model and requires an appropriate EMA or OMA procedure.
Can a scanning laser vibrometer directly measure material damping?
The laser vibrometer measures non-contact vibration response. A damping value must be calculated under defined boundary, excitation, and identification conditions. It cannot be obtained from an ODS animation alone.
Why is a common reference important for scanning ODS testing?
A common reference allows responses acquired at different times and scan points to be compared with a consistent phase basis. Without it, amplitude mapping may still be useful, but phase interpretation and motion animation become limited.
What is the most common risk when comparing multilayer specimens?
Inconsistent boundary conditions are a major risk. Changes in clamping, excitation location, scan grid, or environment can produce response differences that are incorrectly attributed to the material.
Can reflective or uneven surfaces affect laser vibrometer data?
Yes. Surface return, incidence angle, and working distance influence optical signal quality. The setup should be checked before acquisition, and any surface treatment should be documented so that specimen comparisons remain fair.
References
- VIPICO, Gimbal Scanning Laser Vibrometer
- Siemens Digital Industries Software, What is an Operational Deflection Shape (ODS)
- ISO 7626-1:2011, Mechanical vibration and shock — Experimental determination of mechanical mobility — Part 1
Technical review: Mr. Sun | Technical Manager